Bet_Noire
When I think of Vanguard, I think of broadly diversified, market cap weighted passive index funds delivered at the lowest possible cost. While many fund companies have launched very similar products that compete head-on with Vanguard ETFs in several categories, I believe that if this is the investment philosophy you subscribe to, you will probably want to keep it simple and stick with Vanguard funds on any “tie” between similar funds with equal expenses. One major advantage of Vanguard’s “core” fund line-up is that it doesn’t change that often, with the two youngest funds in this article having been launched five and 10 years ago in 2018 and 2013 respectively. Rather, the biggest changes Vanguard fund investors are likely to notice year to year are further fee cuts to existing funds, as was announced in April 2022 for four of the bond funds we will cover here.
This article aims to serve as an updated guide to the best Vanguard funds to buy in 2023 to meet those core objectives of simplicity, broad diversification, and minimal cost. Quite simply, the first two of those objectives are very well met by the following two ETFs:
- Vanguard Total World Stock ETF (NYSEARCA:VT), expense ratio 0.07%
- Vanguard Total World Bond ETF (NASDAQ:BNDW), expense ratio 0.06%
The rest of this article mostly looks at the trade-off between the simplicity of this two-fund portfolio versus one that breaks down the exposure of VT and BNDW to further lower costs and provide somewhat more tax efficiency. The below diagram should serve as a brief visual outline for how the following sections break down VT and BNDW into funds providing pieces of the same global portfolio.
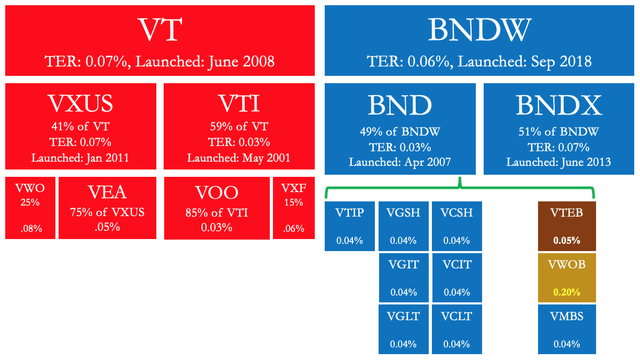
Vanguard data, Author’s own illustration
Global Stock Exposure: VT vs VTI + VXUS
As seen in the above diagram, VT breaks down cleanly into the following two ETFs:
- Vanguard Total Stock Market ETF (VTI), covering US stocks, and
- Vanguard Total International Stock ETF (VXUS) covering non-US stocks
As of this writing, about 59% of VT is the US stock portfolio in VTI, which the remaining 41% is the portfolio in VXUS. Both VT and VXUS have the same expense ratio of 0.07% per year, but VTI’s expense ratio is less than half that level at only 0.03% per year. That means that an investor in VT is paying more than double the expense ratio on more than half of the portfolio versus an investor with a 59% VTI + 41% VXUS portfolio. That description may sound dramatic, but bear in mind the total expenses of $1,000,000 invested in VT would still only be about $236 per year more than the portfolio of $590,000 in VTI + $410,000 in VXUS.
Splitting your VT exposure into VTI and VXUS may also have tax advantages if you have both US taxable and tax-deferred accounts like an IRA or 401k. In that case, your adviser may suggest holding VTI in your IRA, where all US taxes on dividends can be deferred, while holding VXUS in your taxable account in order to claim the foreign tax credit on taxes withheld by non-US dividend sources. Just to give a very rough idea of how this can be more significant than the expense ratio, the $410,000 assumed above to be invested in VXUS would earn $12,300 in dividends at a 3% yield, and a 15% assumed foreign withholding rate on that would be about $1,800 per year in possible foreign tax credits.
These two advantages of splitting VT exposure into VTI and VXUS might explain why both VTI and VXUS each have far more assets under management than VT, though home country bias of US Vanguard investors (including Bogle himself) towards US stocks may also play a role.
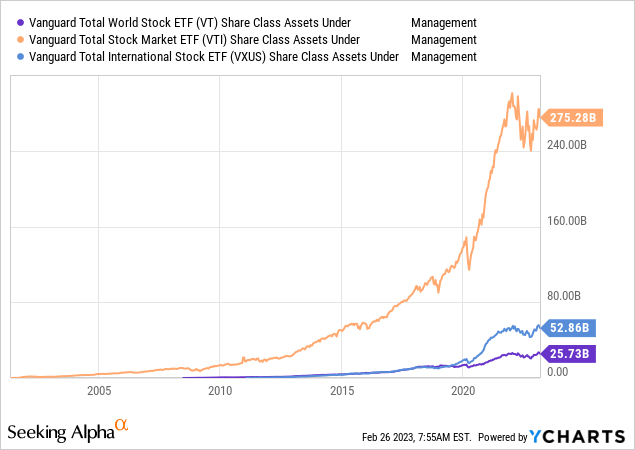
In the next section, we will break down VXUS into developed and emerging markets and show that the home country bias is still very real, but not as extreme as in the above chart.
International Stocks: VXUS vs VEA + VWO
The “Total International Stock Market” portfolio in VXUS can be further broken down into two more parts:
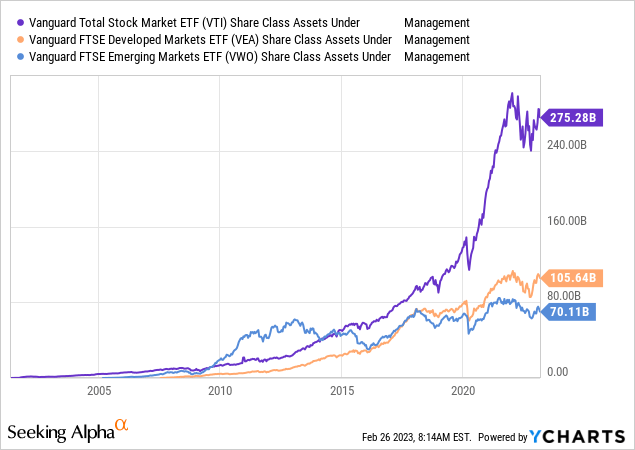
Neither VT nor VXUS nor VWO have any allocation to markets like Vietnam or Nigeria that are generally considered “Frontier Markets“, so “Emerging Markets” are as far as Vanguard currently covers. As of this writing, VXUS is about 75% VEA and 25% VWO. Since VXUS currently has an expense ratio of 0.07% while VEA’s is 0.05% and VWO’s 0.08%, this means a portfolio of $750K VEA + $250K VWO would save $125 per year in expenses versus $1 million in VXUS. Putting this and the previous section together, we compare $1 million in VT with $700 per year in expenses, versus $590K VT + $310K VEA + $100K VWO with expenses of $412 per year.
This further fee improvement may explain why VEA and VWO each have significantly more assets under management than VXUS or VT. Together these three ETFs’ AUM numbers show an asset allocation impressively close to 60% US + 40% non-US stocks, though with a relatively higher allocation to emerging than to developed markets than the weights in VT or VXUS. That highlights one possible downside of splitting up your VT exposure into different funds to save a few hundred dollars in fees: such splitting may tempt you to put together an allocation significantly different than VT, with performance differences greatly exceeding fee differences.
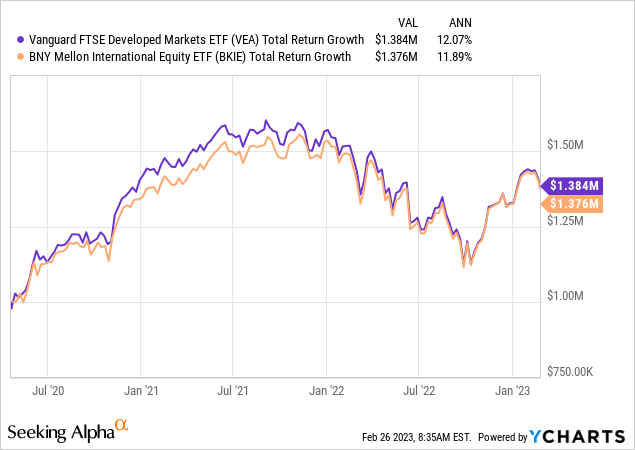
Almost two years ago in April 2020, Vanguard saw its fees undercut by a lineup of ETFs by BNY Mellon with expense ratios of zero (0.00%). In the international equity category, the BNY Mellon International Equity ETF (BKIE) charges only 0.04% versus VEA’s current 0.05%. Although BKIE would save $100 per year per $1,000,000 invested, it is worth mentioning three key points about BKIE:
- BKIE has a far narrower portfolio of a few hundred stocks versus the thousands in VEA,
- BKIE does not include Korea, which its index provider considers an emerging market, while VEA does include Korea, which FTSE considers a developed market, so mixing BKIE with VWO would exclude Korea, and
- As the chart below shows, the tracking error between VEA and BKIE in BKIE’s first two years are well in excess of 0.01%
Next, we break down VTI the same way we just broke down VXUS.
US Stock Portfolios: VTI vs VOO + VXF
The total US stock market fund VTI breaks down into:
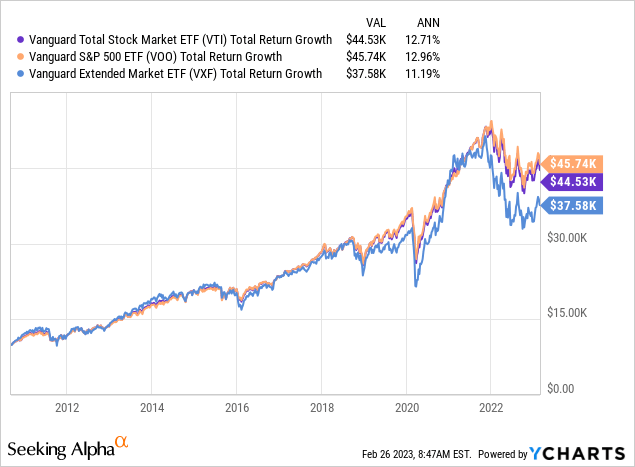
VXF is by definition VTI with the S&P 500 taken out. I recently explained the S&P 500 index itself in far more detail in my article S&P 500 ETFs: 16 Things Smart Investors Should Know, published earlier this month. As of this writing, about 85% of the value of VTI is VOO, and the returns of these two funds move pretty much neck and neck even over decades. The remaining 15% of VTI that is VXF may provide a slight drag to returns when small caps lag large caps as they have since the 2010 launch of VOO:
On the other hand, if we look at the longer track records of the mutual fund versions of VTI, VOO and VXF, we see that small caps have at times provided a return premium over many periods, with 2022 being one of the biggest exceptions.
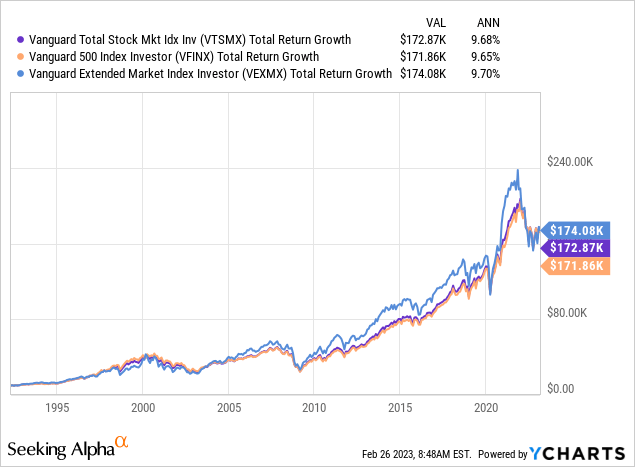
Whether or not small caps have any return premium over large caps is beyond the scope of this article, and something I covered in far more detail in this earlier review of Vanguard’s small cap and value ETFs. What this article cares about is the Vanguard objectives of simplicity, broad diversification, and low fees. Since VTI and VOO both charge 0.03%/year and VXF charges twice as much at 0.06% per year, there does not seem to be any advantage for die-hard Vanguard investors splitting US stock exposure beyond VTI. Rather, any allocation to VOO would probably tempt the investor to overweight the large cap components of the S&P 500 beyond their market weights in VTI.
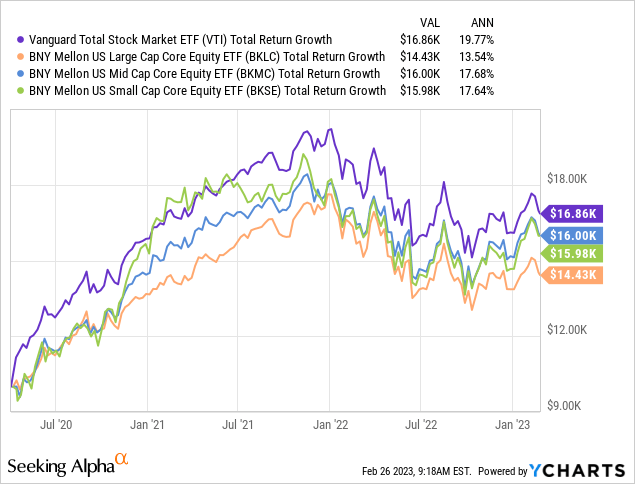
In the US equity category, BNY Mellon also came in with the zero-fee BNY Mellon US Large Cap Core Equity ETF (BKLC) in 2020, though this only covers about 200 large cap companies. To cover the total US stock market with BNY Mellon ETFs, you would need to mix in the BNY Mellon US Mid Cap Core Equity ETF (BKMC) and the BNY Mellon US Small Cap Core Equity ETF (BKSE), each of which charge 0.04% per year, though a mix of around 80% BKLC plus 20% in BKMC and BKSE would add up to less than 0.03% total. That said, in the two years since these BNY Mellon ETFs launched, all three have seen over 60x that difference in tracking error against VTI.
That concludes the stock portion of this review. Now we move on to bonds, starting at the top right side of the above chart with BNDW.
Bonds: BNDW vs BND + BNDX
BNDW is the youngest Vanguard ETF in this article, having only launched in 2018. BNDW is a fund of funds, providing “one-click” exposure to Vanguard’s two total market bond fund ETFs in market weights:
- Vanguard Total Bond Market ETF (BND), covering US bonds, and
- Vanguard Total International Bond ETF (BNDX), covering non-US bonds hedged into US dollars
BNDX actually makes up 51% of BNDW, making the current “Total World Bond” portfolio a very neat balance between US and non-US bonds. In terms of cost, BND charges only 0.03% while BNDX charges 0.07%, so splitting a $1,000,000 investment in BNDW into $510K of BNDX and $490K of BND would save almost $100 per year in expenses. Even more so than with VTI vs VEA and VWO, we see that BND has almost twice as much in assets under management as BNDX.
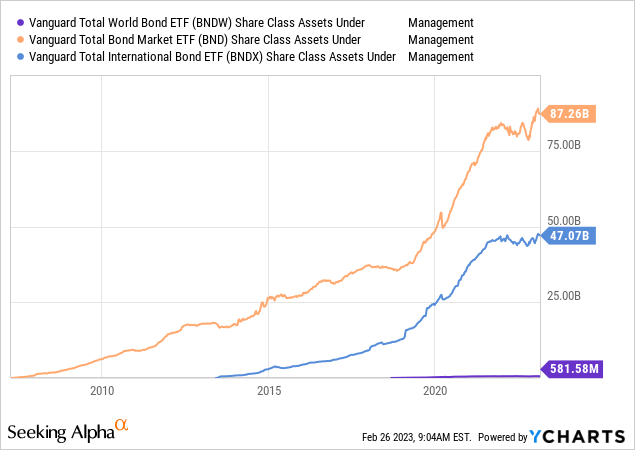
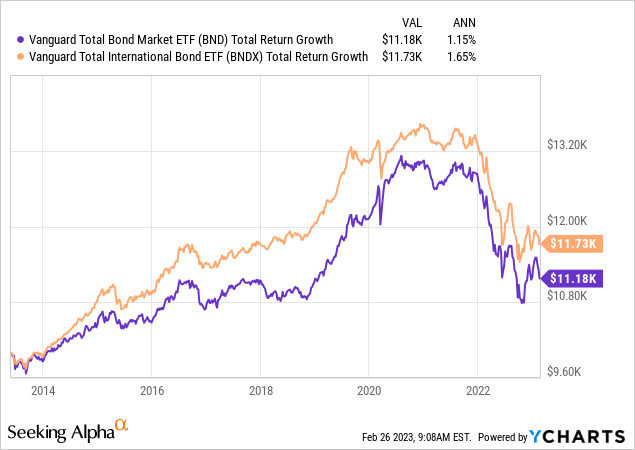
Unlike the outperformance of VTI over VXUS over the past decade, BNDX has actually delivered some outperformance over BND since its launch almost 10 years ago in 2013. Since BNDX is currency hedged, most of its excess return and diversification benefit comes from the fact that foreign yield curves and credit markets, while correlated to the US, can still move somewhat differently than US bond markets.
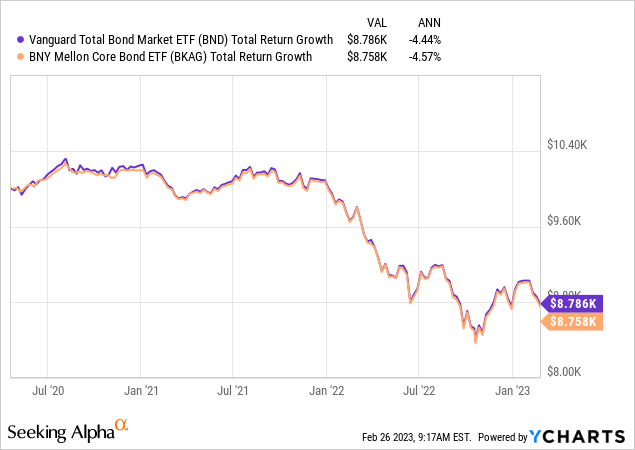
Aggregate US bonds is another category where BNY Mellon launched a zero-fee ETF in 2020: the BNY Mellon Core Bond ETF (BKAG). BKAG has so far tracked BND more closely than BNY Mellon’s ETFs in earlier categories mentioned so far have done, but still with more tracking error than I think will be worth it for most investors looking to save a few basis points.
For someone who truly believes that total market passive indexing is the way to approach the bond market, it could make sense to hold bond exposure via BNDW or a balance of BND and BNDX. I on the other hand think bonds have a more simple purpose of providing a fixed income on a fixed schedule, so I would argue that it makes more sense to pay a tiny bit more for a bond fund that may more closely meet your specific need for bonds in a portfolio. The next section further breaks down BND into 10 specific bond ETFs that might more specifically meet those different bond objectives.
US Bonds: BND vs More Specific Bond Funds
I would argue that many investors who allocate to bonds don’t really want to simply own all bonds in proportion to their issuance size as Vanguard investors generally do with stocks. Even a textbook mean-variance-optimizing investor might see this approach as not as optimal with fixed income, where non-mean-variance-optimizing investors like insurance companies are competing with you to buy mortgage backed securities. Rather, I believe many investors buy bonds because they want a portion of their portfolio that provides a fixed rate of return in their home currency for some period of time. Second, investors might want a portion of their portfolio that increases in value if a recession pushes interest rates (and often their stocks) down in value, which can be accomplished with longer-term bonds. Below is a very quick run through on the 10 Vanguard bond ETFs I listed in my diagram under BND and why a Vanguard investor may want to allocate a specific amount to each one. The first seven of these ETFs have a slightly higher expense ratio than BND at 0.04%/year each, but I strongly believe having bond exposure closer to what your portfolio actually needs is very well worth that.
First, there is the Vanguard Short-Term Inflation-Protected Securities ETF (VTIP), which holds short-term inflation-indexed US treasuries. In today’s market, VTIP will provide a real return of over 1.5% per year above inflation with a duration of 2.6 years, so it will not fluctuate much in price while providing that inflation protection. The downside of VTIP is that the 2.6 year duration means that 1.5% per year above inflation may decline significantly if TIPS yields fall again, especially if they fall back below zero or even -1% where they were only a year ago. For a longer-term lock on that 1.5% over inflation yield, investors may instead consider the iShares TIPS Bond ETF (TIP), which has a duration of 6.8 years, but with a much higher 0.19% expense ratio.
Second and third are the Vanguard Short-Term Treasury ETF (VGSH) and Short-Term Corporate Bond ETF (VCSH), with durations of 1.9 and 2.7 years, yielding 4.3% and 4.9% respectively. This is where to keep relatively short-term cash you want to earn a competitive interest rate on over the next two years without inflation protection and with minimal price fluctuation.
Fourth and fifth are the Vanguard Intermediate-Term Treasury ETF (VGIT) and Intermediate-Term Corporate Bond ETF (VCIT), with durations of 5.2 and 6.2 years, yielding 3.6% and 4.9% respectively. The longer durations mean more price volatility, but also mean you get to lock in those rates for longer if rates fall back down to where they were for most of the past 10 years.
Sixth and seventh are the Vanguard Long-Term Treasury ETF (VGLT) and Long-Term Corporate Bond ETF (VCLT) with durations of 16.3 and 13.3 years, yielding 3.7% and 5.1% respectively. These will have the greatest price fluctuations, as their holding bonds with these fixed rates for the longest amounts of time until maturity.
Eighth is the Vanguard Tax-Exempt Bond ETF (VTEB), which costs a little more at 0.05% and has an intermediate duration of 5.4 years. This one is a little more complex to break down, as the website reports a 3.0% yield to maturity but a 4.5% average coupon, which indicates many of the bonds may be trading at a premium. VTEB would mostly be an alternative to VGIT or VCIT in taxable accounts of investors in high federal income tax brackets who want interest income that is federally tax-exempt.
Ninth is the Vanguard Emerging Markets Government Bond ETF (VWOB), which costs much more at 0.20% and is the closest thing Vanguard currently offers to a high yield bond ETF. VWOB holds bonds issued in US dollars by emerging market governments and corporates, including Indonesia, Qatar, Saudi Arabia, Mexico, and even Argentina. VWOB has a longer duration than VCIT, but also a much higher yield at 6.8%, so arguably fills a niche between bond risk and stock risk that many Vanguard investors may find too niche to bother with.
Tenth and finally is the Vanguard Mortgage-Backed Securities ETF (VMBS), which like the first seven bond ETFs in this section costs only 0.04%. I list VMBS last because the mortgage-backed bonds it holds make up a significant portion of BND, but are probably not what most investors are looking for in their bond exposure. Many mortgage backed bonds are effectively callable, meaning that if interest rates go down the bond can be prepaid, forcing you to reinvest at lower rates, while if yields rise, you have all the downside of owning a longer-term fixed rate bond. While some bond investors do in fact want this type of exposure, I believe it is better separated out rather than mixed in with other bonds in something like BND.
Conclusion
As stated in the beginning, Vanguard investors who want to keep everything simple will find that a portfolio with just two ETFs, VT and BNDW, will do just that at what is still a very low cost of 0.07% per year or less. You can make slight improvements to the total cost and tax treatment by splitting VT into a portfolio of around 59% VTI, 31% VEA and 10% VWO, though if you are truly sticking with the Vanguard philosophy, you shouldn’t let this split tempt you to change the weights. With bonds on the other hand, you can split your BNDW exposure into BND and BNDX, but I believe most investors would be better off going through the ten bond ETFs in the last section and choosing exactly the bond exposure you want. Passive investing means earning market returns with minimal fees, but it should mean being stuck with the 6.6 year duration of BND when what you really need from your bonds is the 1.9 year duration of VGSH or inflation protection of VTIP.

